
 EN
EN
 ar
ar bg
bg hr
hr cs
cs da
da nl
nl fi
fi fr
fr de
de el
el hi
hi it
it ko
ko no
no pl
pl pt
pt ro
ro ru
ru es
es sv
sv tl
tl iw
iw id
id lv
lv lt
lt sr
sr sk
sk sl
sl uk
uk vi
vi et
et hu
hu th
th tr
tr fa
fa ms
ms hy
hy ka
ka ur
ur bn
bn mn
mn ta
ta kk
kk uz
uz ku
ku
Visualization Software
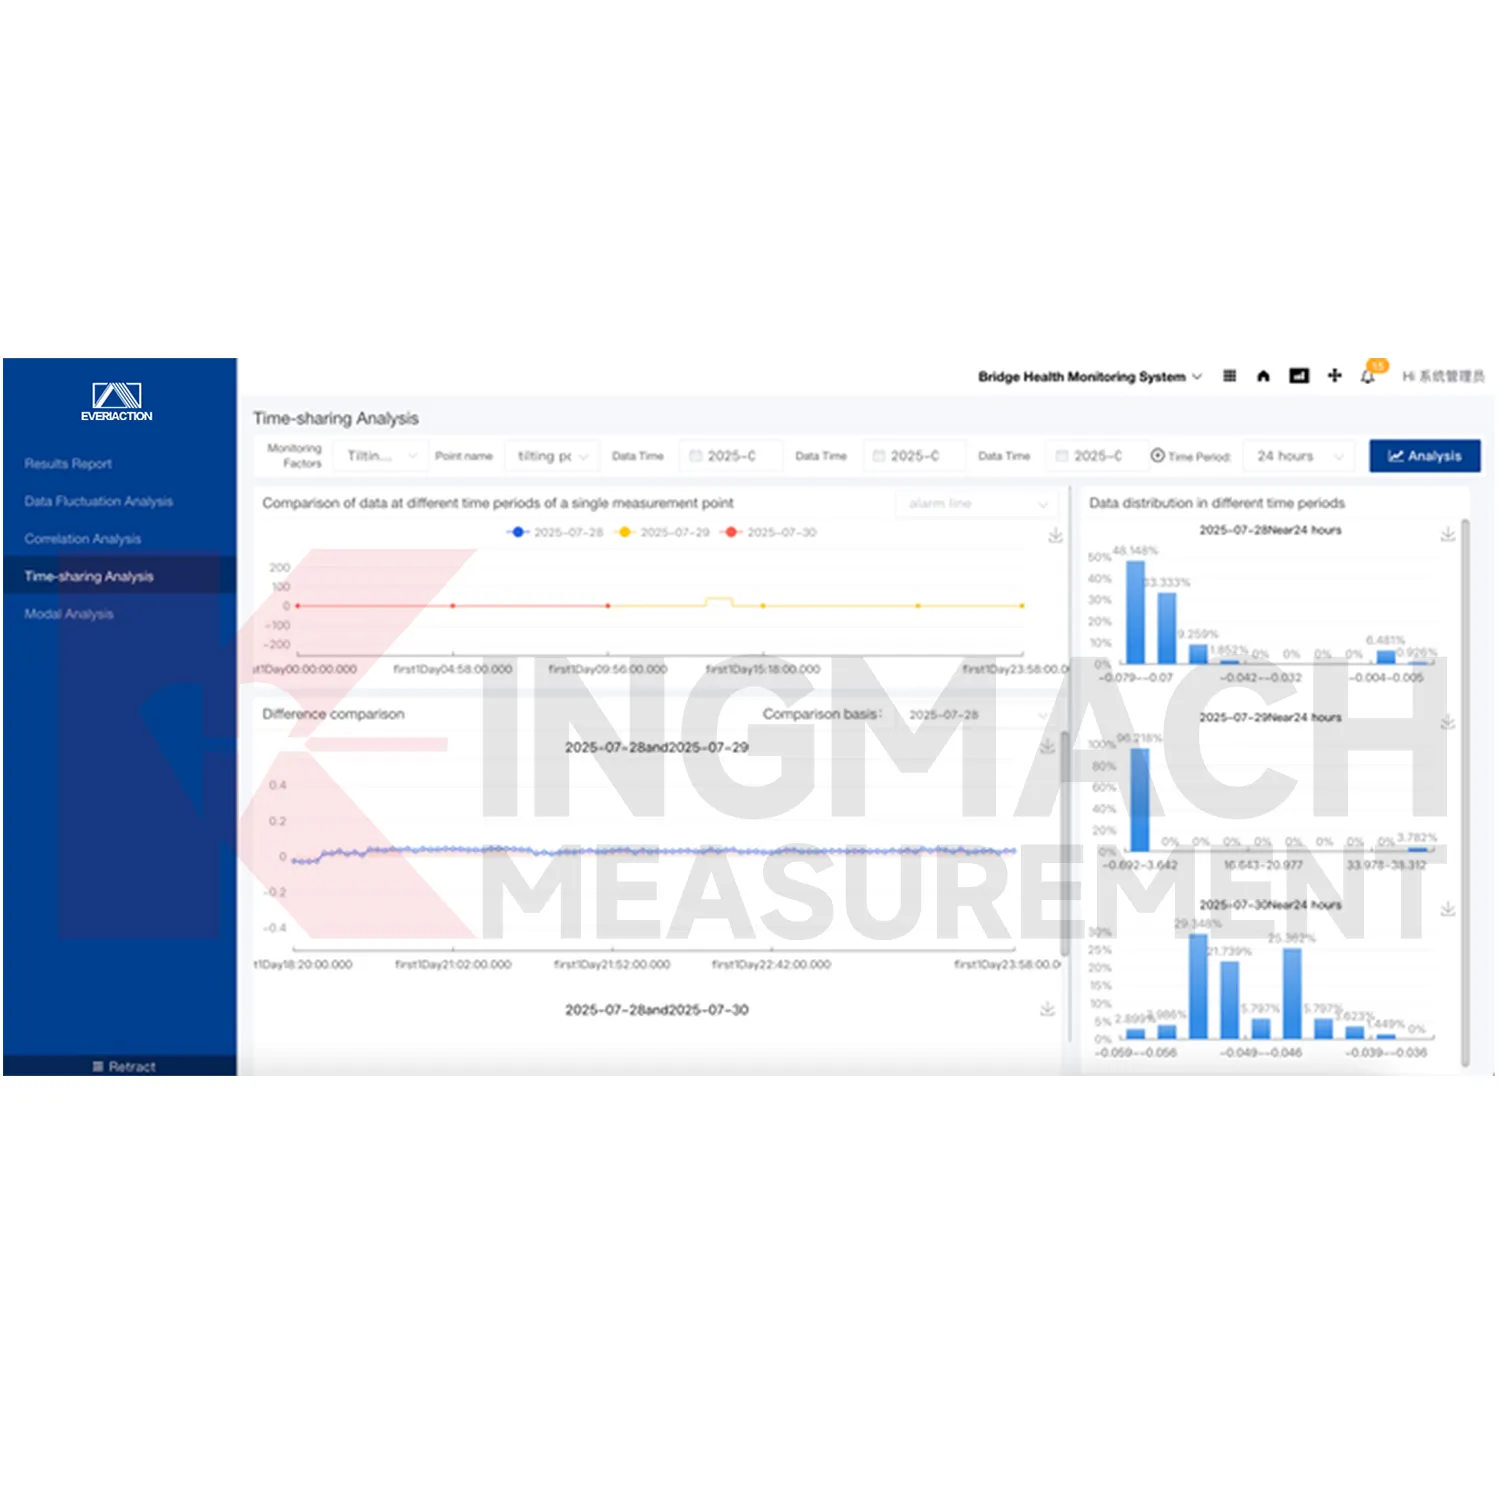
Kingmach Visualization Software can work with different sensor categories across the Kingmach product ecosystem. It may receive data from strain gauges, load cells, displacement transducers, settlement sensors, tiltmeters, environmental monitoring devices, accelerometers, weir flow meters, readouts, data loggers, and related acquisition hardware. The benefit is not only that the data appears on one screen. The benefit is that related structural behavior can be compared across channels, making it easier to understand whether a change is local, environmental, construction-related, or part of a wider asset response.
Application of Visualization Software
Foundation pit monitoring uses Kingmach Visualization Software to coordinate support force, displacement, settlement, groundwater, tilt, and environmental records during construction. Pit sites change quickly, and data must be reviewed alongside excavation stage, support installation, rainfall, pumping, and nearby building response. Flexible alarm rules help the team distinguish routine stage-related movement from a reading that needs inspection. Project documents and dynamic information also help later reviewers understand what was happening when a trend changed.
The future of Visualization Software
Cloud computing will support wider remote use of Kingmach Visualization Software. Owners and engineering teams may need to review assets from offices, field sites, control centers, or mobile workstations. Cloud-based access helps keep monitoring visible even when the structure is difficult to reach. Remote review will not replace field verification, but it can improve timing. Teams can identify which area needs inspection, what related data should be checked, and which documents should be prepared before arriving on site.
Care & Maintenance of Visualization Software
Data quality checks should be routine in Kingmach Visualization Software. Look for missing values, frozen channels, impossible jumps, timestamp errors, unit mismatch, repeated noise, or disagreement between related sensors. A platform can display data quickly, but engineering trust depends on the quality of the incoming records. When a problem appears, check the field device, cable, communication path, acquisition module, and recent configuration changes before treating the reading as structural behavior.
Kingmach Visualization Software
For project managers, Kingmach Visualization Software gives each monitored asset a defined operating file instead of a loose collection of screens. The team can maintain project basics, live status, inspection notes, maintenance activity, alarm levels, and documents under the same project name. This is useful when an owner needs to explain who checked the data, what changed on site, which alarm was acknowledged, and which report followed. The platform turns daily monitoring into a traceable management routine, so later audits can follow the project history without rebuilding it from scattered folders.
FAQ
Q: How should a project be prepared?
A: Define asset folders, monitoring zones, measuring points, units, alert grades, and report needs before launch.
Q: What should be tested at go-live?
A: Test incoming values, time order, engineering units, graph refresh, alarm trigger, and export output.
Q: Why does alarm logic need review?
A: Different sensor categories and risk levels may need different limits, rates, and escalation steps.
Q: How should files stay current?
A: Update drawings, point lists, photos, inspection notes, maintenance logs, and reports when the site changes.
Q: What should follow a platform update?
A: Run a short acceptance check on live values, graph pages, alerts, exports, accounts, and stored files.
Reviews
Ryan Lewis
Fast delivery and excellent product quality. The accelerometers and tiltmeters are highly reliable. Strongly recommend this company.
David Wilson
We purchased displacement transducers and settlement sensors, and the quality exceeded our expectations. Easy installation and reliable performance.
Latest Inquiries
To protect the privacy of our buyers, only public service email domains like Gmail, Yahoo, and MSN will be displayed. Additionally, only a limited portion of the inquiry content will be shown.
Sophia***@gmail.comUnited Kingdom
Good day, we need environmental monitoring sensors including temperature, humidity, and wind sensors...
Amelia***@gmail.comSingapore
Hello, I am looking for visualization software for monitoring system data analysis. Please let me kn...
Related product categories
- Monitoring Software Suite
- Monitoring system software platform
- Environmental Monitoring
- Visualization Software
- GPS Displacement Monitoring System
- Integrated Monitoring Station
- Settlement Monitoring Rod
- Structural Health Monitoring (SHM) System
- Structural Monitoring Cloud Platform
- IoT Online Monitoring System
- Monitoring System Platform & Services
- Engineering Pulse Intelligent Monitoring Cloud Platform