 ar
ar bg
bg hr
hr cs
cs da
da nl
nl fi
fi fr
fr de
de el
el hi
hi it
it ko
ko no
no pl
pl pt
pt ro
ro ru
ru es
es sv
sv tl
tl iw
iw id
id lv
lv lt
lt sr
sr sk
sk sl
sl uk
uk vi
vi et
et hu
hu th
th tr
tr fa
fa ms
ms hy
hy ka
ka ur
ur bn
bn mn
mn ta
ta kk
kk uz
uz ku
ku
resistance temperature sensors
Rainfall monitoring in Kingmach resistance temperature sensors provides the time record behind many water-related engineering events. A rain point should be open to the sky, level, clean, and protected from splash, leaves, dust, and nearby obstructions. The data is useful because it turns a storm into a dated sequence that can be compared with slope movement, seepage, runoff, settlement, pore pressure, tunnel leakage, or construction delays. Long-term rainfall records also help owners understand seasonal behavior. A small storm after many wet days may create more response than a larger storm after dry weather. A well-maintained rainfall record helps explain that difference. For reports, the most useful information is not only the total rain amount, but also timing, duration, intensity pattern, and whether related ground or structural sensors changed afterward.
During abnormal events, the first question is not only whether the value crossed a limit. The reviewer should ask what changed around the site, whether the related structure reacted, and whether a field inspection confirmed the same pattern.
Long-term value comes from consistency. A channel that keeps the same location, unit, maintenance history, and linked asset record can support seasonal comparison, post-storm review, and handover between construction and operation teams.
Maintenance teams should record cleaning, access difficulty, enclosure condition, cable repair, vegetation growth, nearby equipment changes, and the first normal reading after work. Those notes protect the meaning of the curve when old data is reviewed months later.
Application of resistance temperature sensors
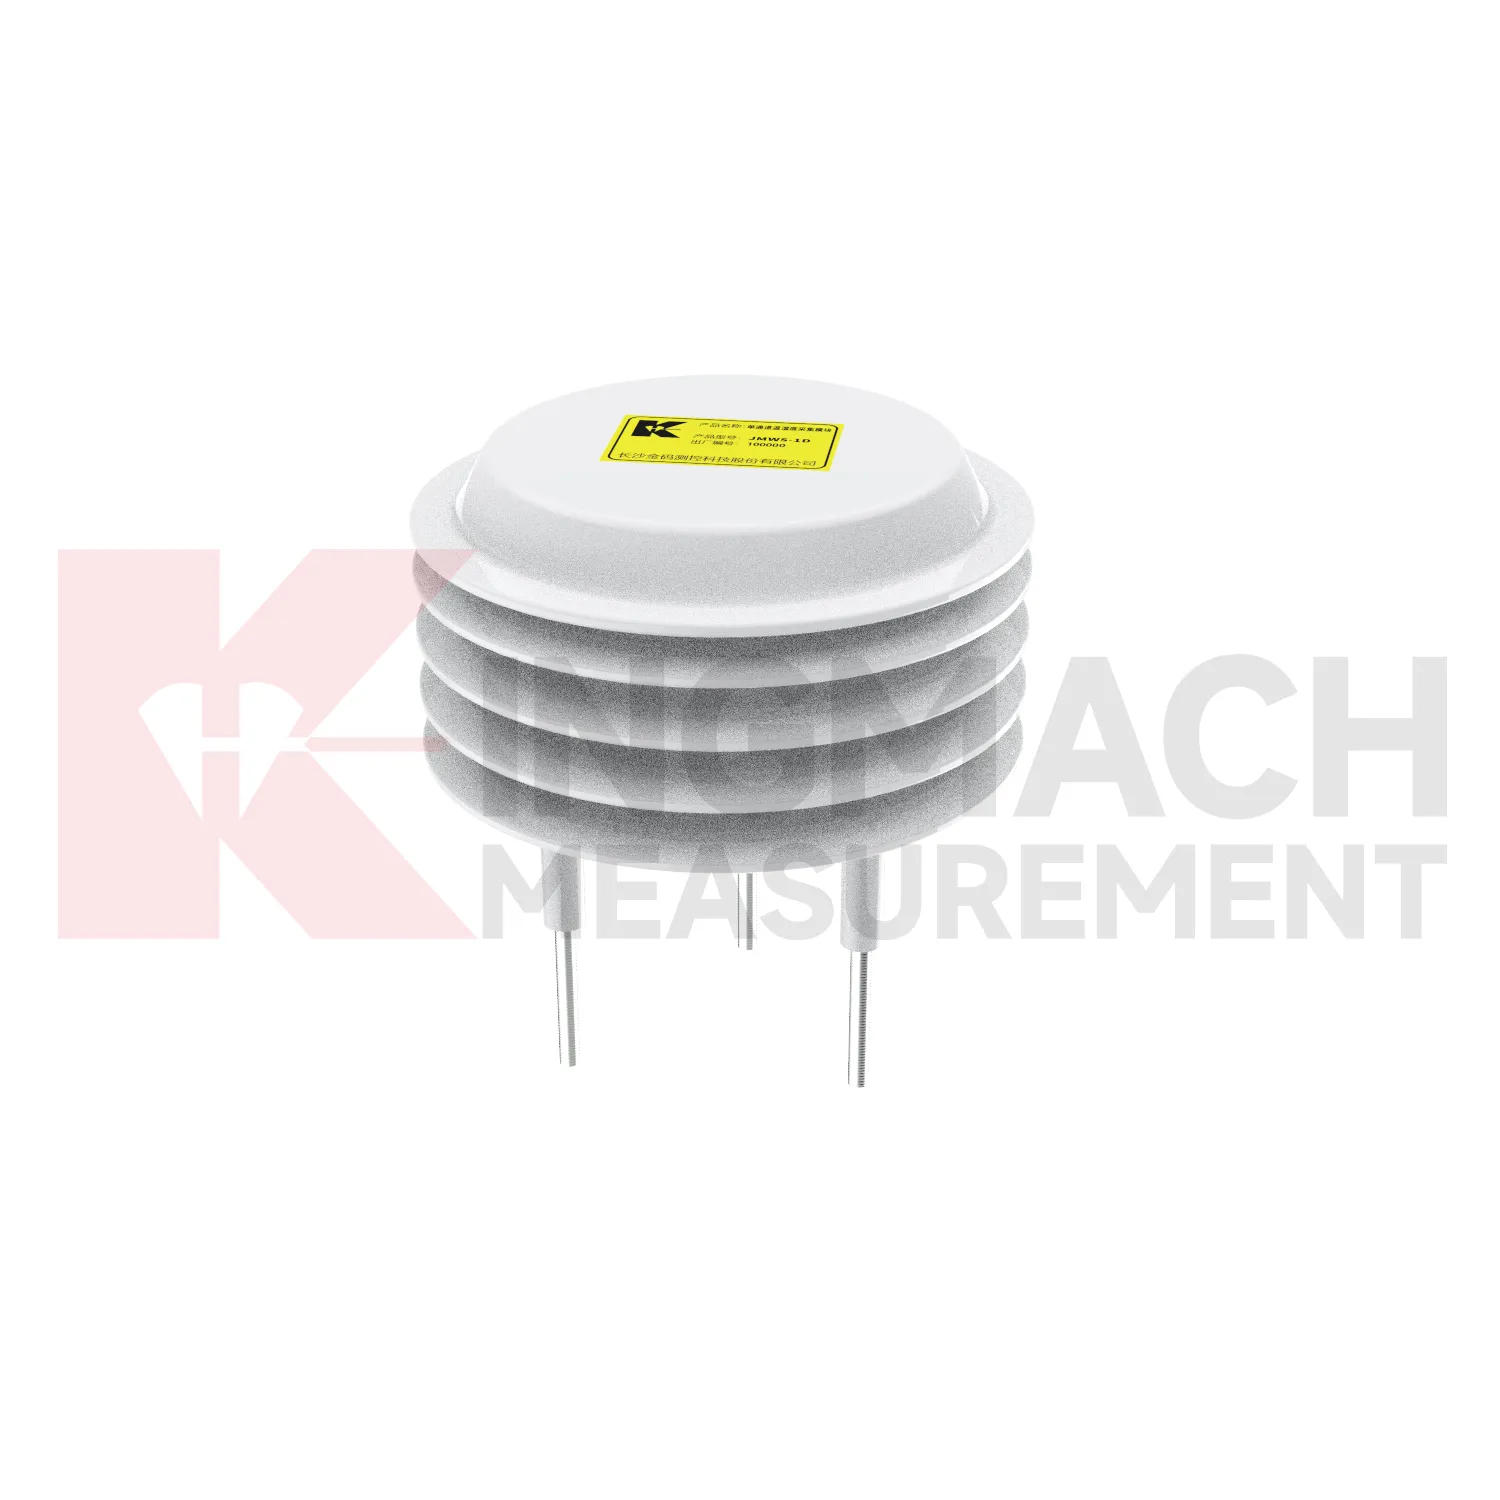
Geotechnical engineering uses Kingmach resistance temperature sensors to explain how water and weather affect ground behavior. Soil wetness, rainfall, temperature, and humidity can influence slopes, embankments, foundation pits, tunnel portals, retaining walls, and reclamation areas. Environmental data should be reviewed with inclinometers, settlement sensors, displacement meters, pore-pressure records, and field inspections. A deformation curve during dry weather may suggest a different cause than a curve following repeated rainfall and rising soil wetness. Engineers also need to know whether construction work, loading, drainage changes, or excavation occurred during the same period. Environmental monitoring gives the missing condition layer, helping the team move from “the ground moved” to a more useful question: what changed around the ground before it moved?
If the reading seems unusual, the team should check the physical condition of the station before drawing conclusions about the asset. Blockage, poor exposure, loose wiring, water entry, and changed surroundings can all create misleading patterns.
A practical report links the condition value with time, place, and action. It should help a reviewer decide whether to keep observing, inspect the field point, compare nearby instruments, or record the event as normal site behavior.
For owners, the strongest record is the one that remains understandable after staff changes. Clear units, plain point names, installation photos, maintenance notes, and linked structural channels make the data usable beyond the original project team.
The future of resistance temperature sensors
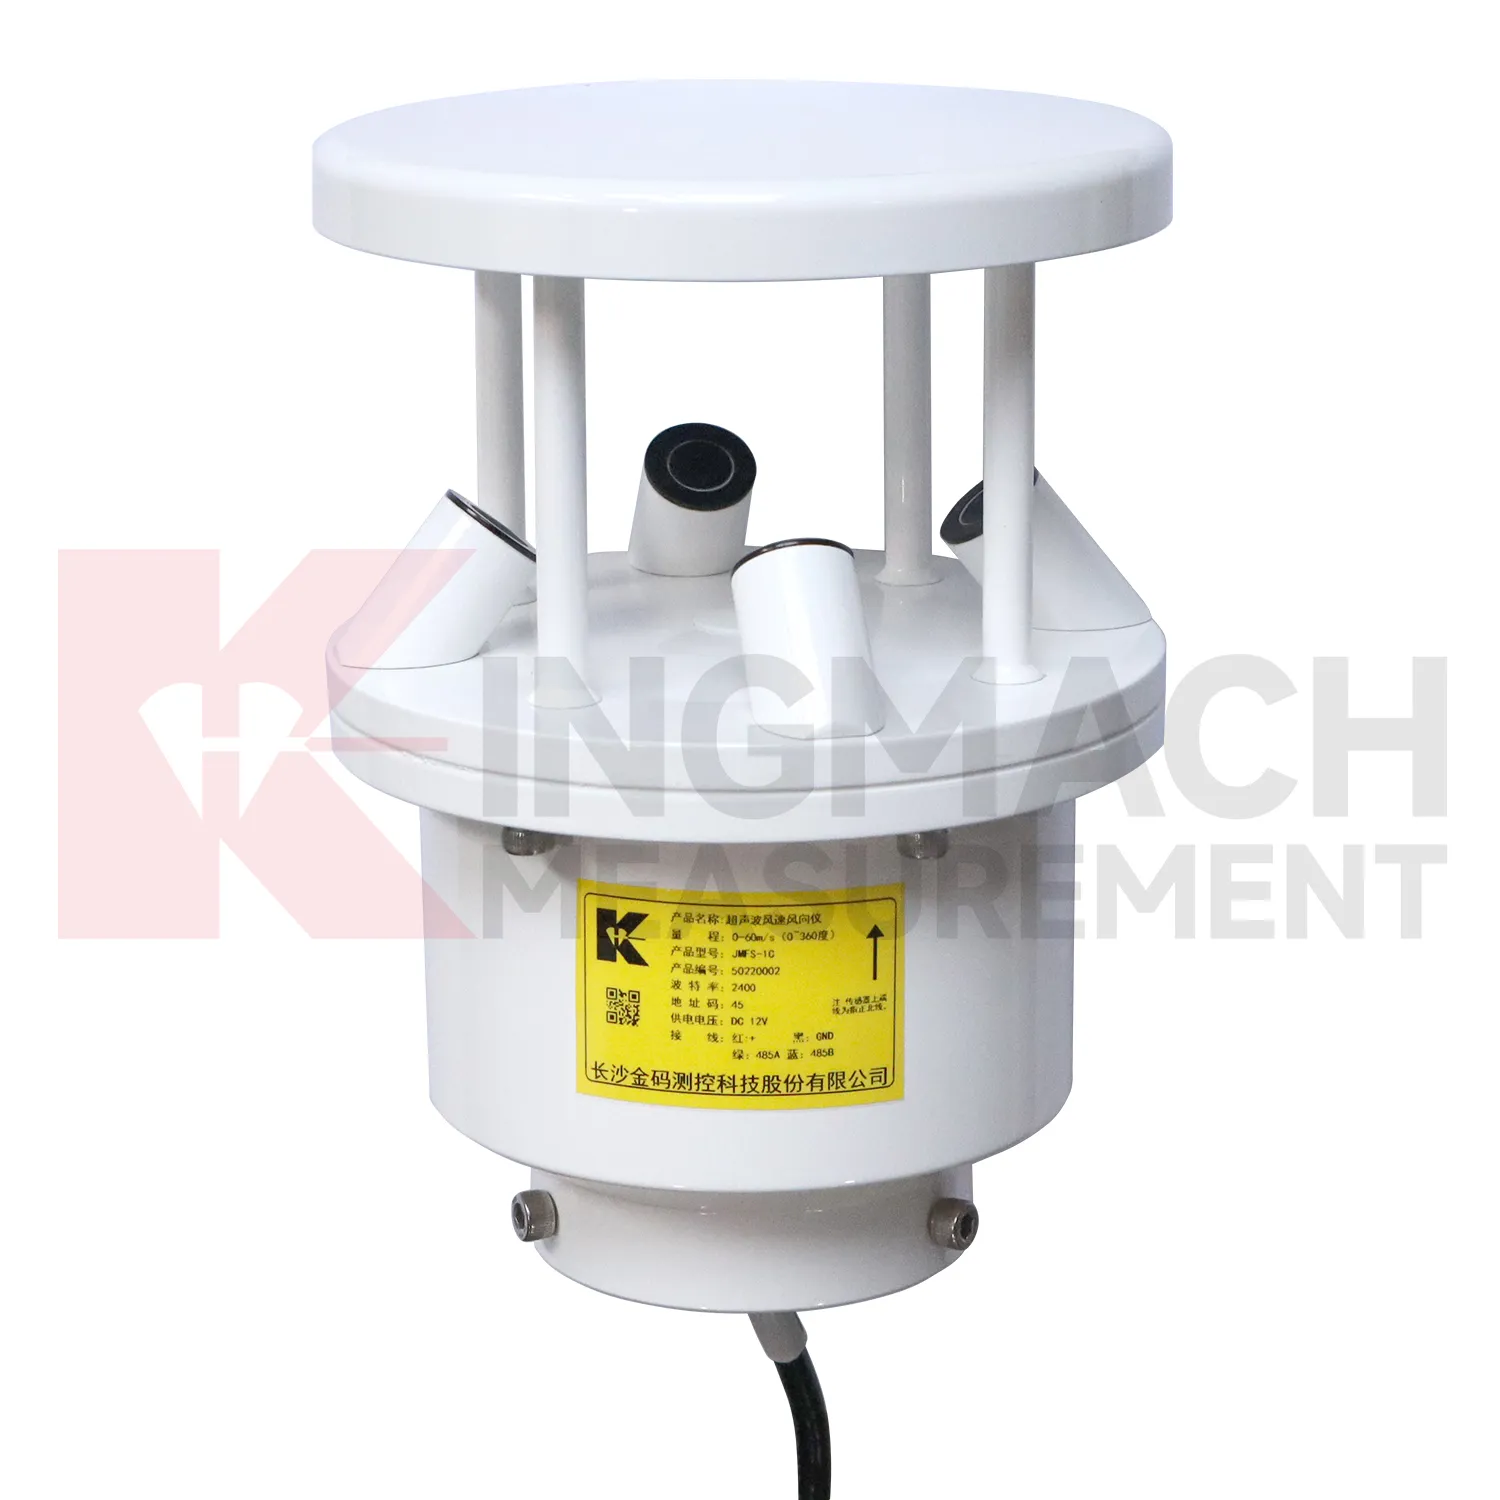
Wind context will become a stronger part of future Kingmach resistance temperature sensors for bridges, towers, airports, marine structures, and high buildings. Wind speed alone is often not enough; direction, gust timing, pressure, temperature, and structural response all matter. Future platforms should connect wind records with acceleration, tilt, displacement, strain, and inspection events. When vibration rises, the reviewer can quickly judge whether it matched known exposure or points to a separate issue. This will improve confidence during storms and high-wind periods. It will also help owners decide when to schedule inspection, restrict access, or compare present response with earlier events.
Wind-event records should also keep exposure notes, station height, nearby obstructions, and maintenance access visible. A sensor mounted on a roof edge, bridge tower, airport mast, or coastal structure may see very different airflow from a sheltered point nearby. Future reporting should make that difference clear so teams do not compare unrelated wind records as if they represent the same condition.
For long-term review, repeated wind events can become a useful operating history. Owners can compare similar wind directions across seasons, check whether structural response remains stable, and decide whether an inspection is needed after a severe event. That turns wind monitoring into a maintenance planning tool rather than only a weather record.
Care & Maintenance of resistance temperature sensors
Rainfall maintenance for Kingmach resistance temperature sensors should focus on keeping the catchment path clean and level. Leaves, dust, insects, scale, bird droppings, splash, and tilted mounting can distort rainfall records. The rain point should be inspected after storms, long dry periods, nearby earthwork, and seasonal debris build-up. Cleaning should be logged with date, condition, leveling status, and the first normal reading after work. Rainfall data is often used to explain slope movement, seepage, tunnel leakage, construction delay, or drainage performance. If the rain record is wrong, the engineering interpretation may also be wrong. Simple field care protects a much larger monitoring decision.
Maintenance teams should record cleaning, access difficulty, enclosure condition, cable repair, vegetation growth, nearby equipment changes, and the first normal reading after work. Those notes protect the meaning of the curve when old data is reviewed months later.
The environmental point should be part of a named monitoring question. It may explain wetting, drying, wind exposure, thermal movement, cabinet stress, or pressure variation, but that purpose needs to be visible in drawings and reports.
Kingmach resistance temperature sensors
A strong Kingmach resistance temperature sensors plan keeps the writing and the system focused on site conditions rather than product lists. The page should help a reader understand how weather, moisture, pressure, temperature, and humidity affect the assets they are responsible for. It should explain how environmental readings support slope review, bridge response, tunnel operation, dam inspection, irrigation control, construction records, and long-term maintenance. It should not read like a catalog of devices or a compressed specification table. The buyer needs a monitoring approach that connects field conditions with engineering decisions. That approach is what makes environmental data worth collecting over months and years.
Maintenance teams should record cleaning, access difficulty, enclosure condition, cable repair, vegetation growth, nearby equipment changes, and the first normal reading after work. Those notes protect the meaning of the curve when old data is reviewed months later.
The environmental point should be part of a named monitoring question. It may explain wetting, drying, wind exposure, thermal movement, cabinet stress, or pressure variation, but that purpose needs to be visible in drawings and reports.
FAQ
Q: Where should a rain point be placed?
A: It should be level, open to the sky, and away from obstructions, splash sources, roof edges, and debris-prone areas.
Q: Where should wind be measured?
A: Wind should be measured where airflow represents the asset or work area being reviewed, not behind a wall or sheltered obstruction.
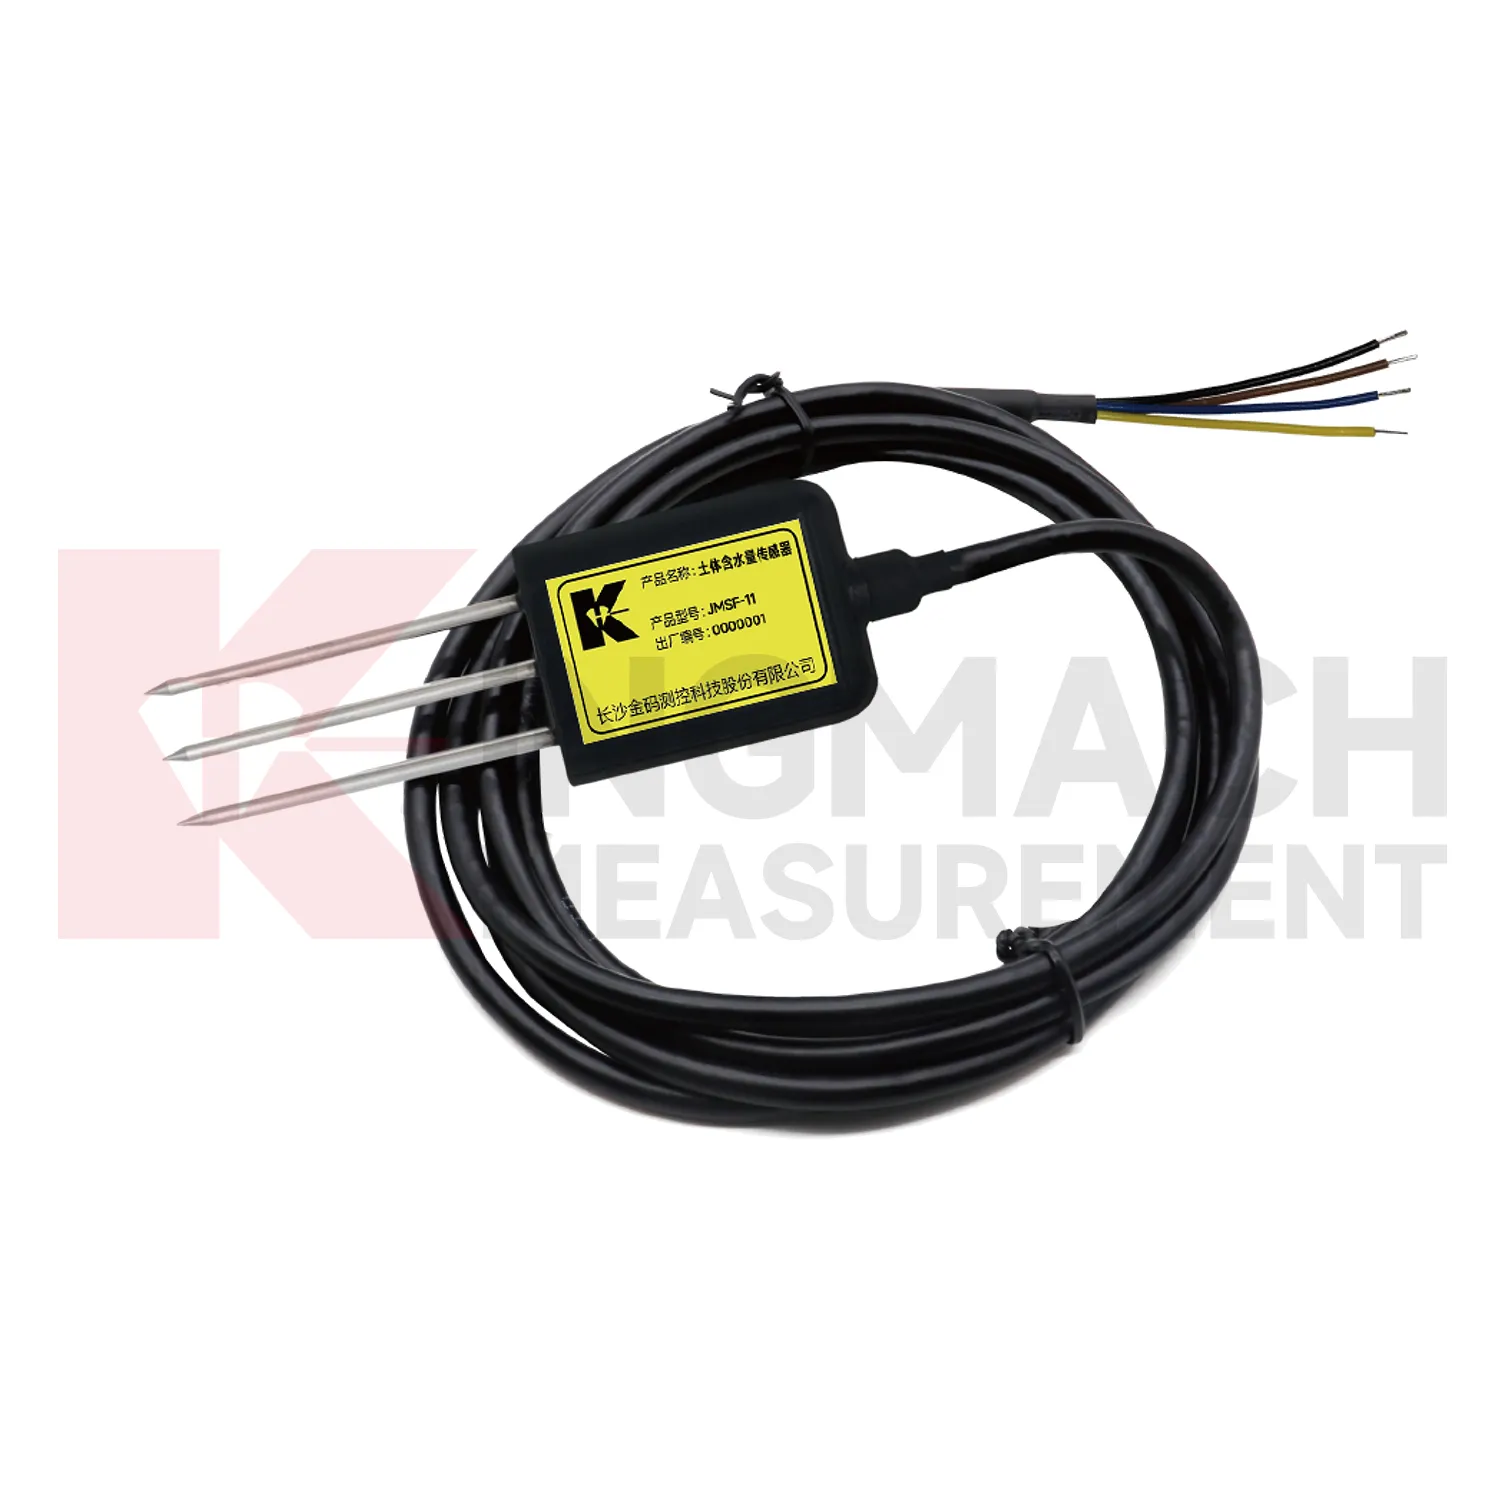
Q: How should soil points be installed?
A: They should have firm contact with the surrounding soil, a recorded depth, protected cable route, and a stable first value.
Q: What should commissioning records include?
A: Include point location, measured condition, unit, mounting photo, cable route, power source, data channel, and linked structural record.
Q: Why are photos useful?
A: Photos help future reviewers understand exposure, mounting, cable routing, and whether later site changes affected readings.
Maintenance teams should record cleaning, access difficulty, enclosure condition, cable repair, vegetation growth, nearby equipment changes, and the first normal reading after work. Those notes protect the meaning of the curve when old data is reviewed months later.
Reviews
David Wilson
We purchased displacement transducers and settlement sensors, and the quality exceeded our expectations. Easy installation and reliable performance.
Daniel Brown
Excellent environmental monitoring sensors. The data is consistent, and the system integrates smoothly with our existing setup.
Latest Inquiries
To protect the privacy of our buyers, only public service email domains like Gmail, Yahoo, and MSN will be displayed. Additionally, only a limited portion of the inquiry content will be shown.
Charlotte***@gmail.comUnited Arab Emirates
Hi, we require instrumentation cables suitable for harsh environments. Could you advise on specifica...
Harper***@gmail.comIndia
Dear Sir, we are planning to procure a complete monitoring system including strain gauges, tiltmeter...
Related product categories
- semiconductor based temperature sensor
- semiconductor based ic temperature sensor
- semiconductor-based temperature sensors
- resistance temperature detector sensor
- resistive temperature sensor
- resistance temperature sensor
- platinum resistance temperature sensor
- resistive temperature sensors
- resistance type temperature sensors
- resistance temperature sensors
- temperature sensor resistance
- ambient temperature sensor resistance